
Coding workflow with VSCode
In the previous lessons we have focused our attention on the main constructs of the Julia language and how to code. In this lesson, I will give you a few tips and tricks. We will learn how to write code efficiently using Visual Studio Code and the Julia extension.
We will see how Revise can improve our code writing and testing efficiency. Furthermore, we will learn some useful tricks and features, such as automatic code formatting, multi-line cursors, multi-panel coding, code navigation, documentation navigation, variable exploration and debugging.
In this lesson I will feature the Windows/Linux shortcuts for commands. If you are using a mac, the shortcuts might be different. It will often be sufficient to replace the CTRL button with the CMD button.
You can find the code for these examples here.
Let’s get going!
Revise
Imagine that you are writing a library. You have a package with a module with several functions inside (see the lesson on packages). As the number of functions inside a module increase, recompiling the whole module every time you add a new function, or modify one, becomes increasingly long and tedious.
For this specific reason, Revise comes in our help!
To install Revise, simply type in the REPL:
using Pkg; Pkg.add("Revise")
Now let’s imagine that we are developing TestPackage1. In order to properly activate the functionalities of Revise, we need to import the library before we load our package. The code will then look like this:
using Pkg
Pkg.activate("TestPackage1")
using Revise
using TestPackage1
If we call the TestPackage1.greet() function, a greetings message will be printed in the REPL: Hello World!.
Now, let’s suppose that we want to change the greetings message. Since we are using Revise, all we need to do is change the function in the TestPackage1\src\TestPackage1.jl file and save it. In particular, let’s change line 6 and have this new message:
greet() = print("Hello from TechyTok!")
Now, if we call TestPackage1.greet() again (without restarting Julia), it will print Hello from TechyTok!, and we didn’t need to recompile the module!
With the help of Revise, we can make any modification to our module, i.e. add or remove functions, change names, or add new variables without the need to restart Julia. This feature will save you a few minutes every time you need to do an edit, or while you are debugging.
Code formatting
When we code, we don’t always follow the style guidelines. For example, we don’t care about perfectly aligning every piece of code, maybe we don’t use spaces before and after a = symbol, or we don’t add the correct spacing everywhere.
Fortunately for us, the code formatter comes in our help. Simply press ALT+SHIFT+Enter with a file open on VSCode and the Julia extension will take care of it! Please note, that the Language Server must be running before we can format some Julia code, so please run a piece of your code before you try to format a document.
In case you don’t want to format your whole code, you can also select a piece of code and press ALT+SHIFT+Enter, and Julia will only format that piece of code.
Multi panel coding
Sometimes, it becomes useful to code with two files open at the same time. For example. you might want to take a look at one file where a function is implemented and use it in another one. Or you need to see at the same time two different lines of the same file. In this regard, panels come in our help.
In order to split a window in more panels, right click on the tab of a file and a context menu will show several options:
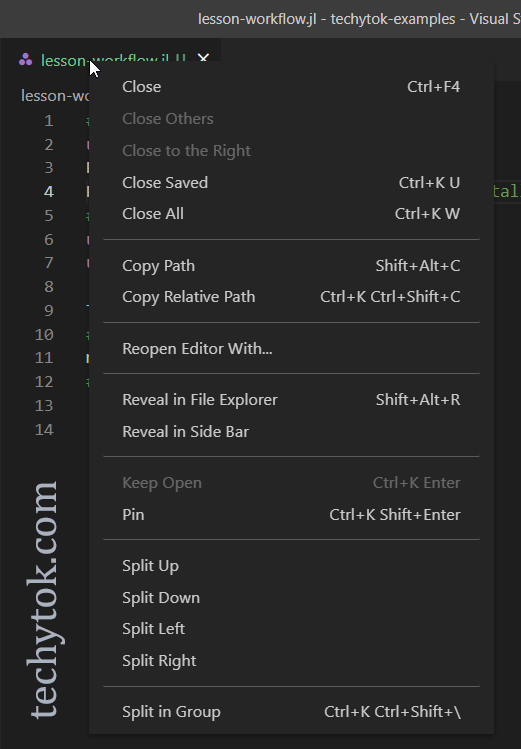
Let’s consider all the possible options and see what they do:
- Split up/down/left/right
- Split in group
Split up/down/right/left
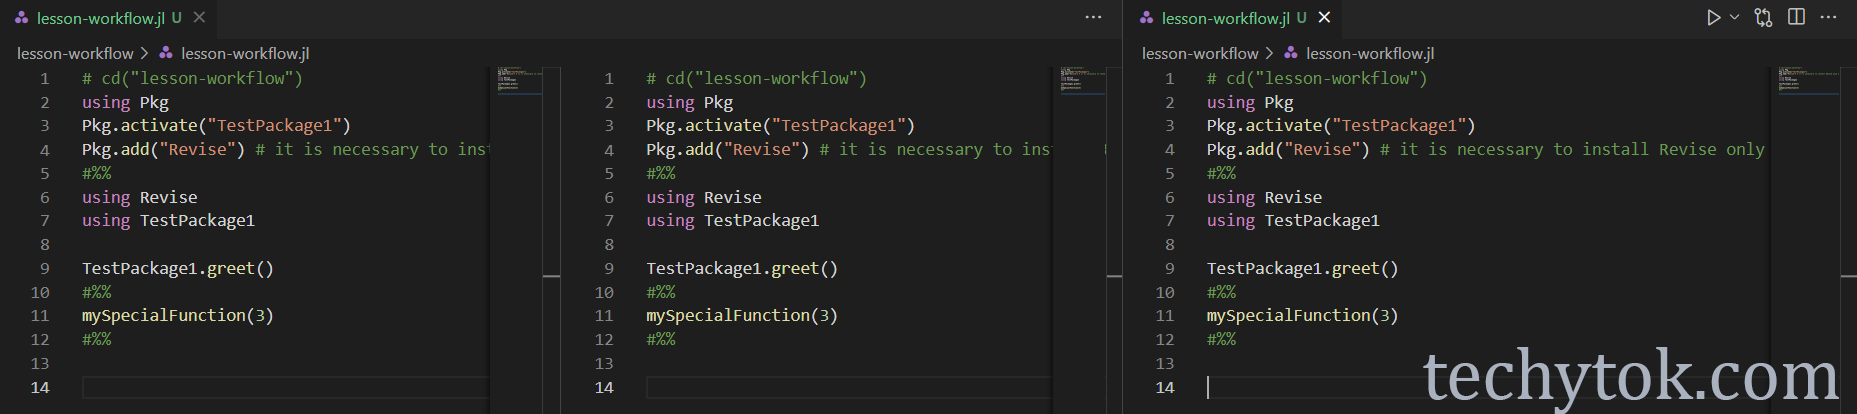
If you click one of these options (for example split right) a panel will open on a side of the screen (the right side in our case). It will look like you have opened the same file twice, while the file is actually the same one. This way, each modification you make on the file will be “mirrored” on each panel.
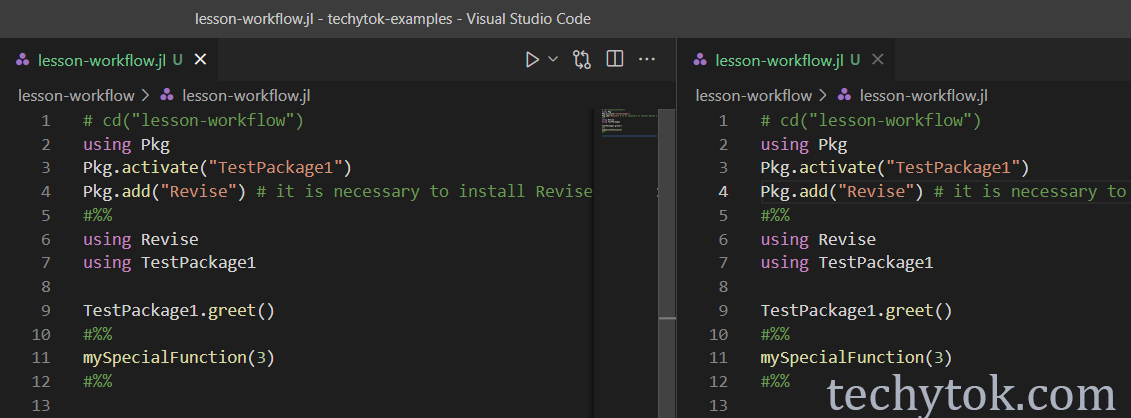
This option is especially useful if you need to edit/see two different file at the same time. You can drag and drop file tabs from each panel to another one, and you are only limited by the size of your screen. Remember that if you need more space on your screen, you can collapse the file browser panel on the left by pressing the explorer icon (the one with two sheets, on hte top left of your screen).
Split in group
Sometimes, you need to edit or read several places in the same file. In this case, the Split in Group option might be preferable.
When you split a file in group, you will see something like that:
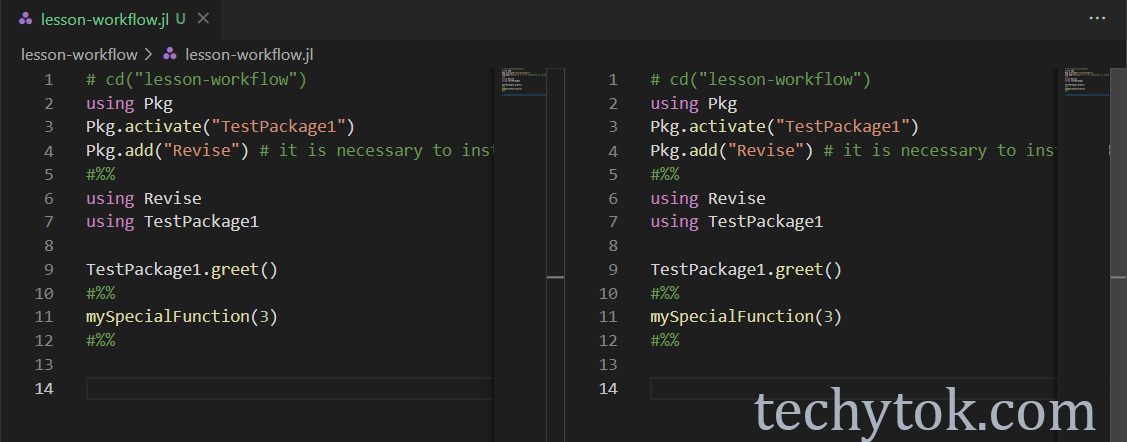
As you can see, the file is not opened inside a new panel, and it is instead split in the same panel. If you switch to another tab, the new file will not be displayed in a split view, and if you come back to the previous file the split view will remain in place. This is extremely useful if you need to explore several parts of the same file and you don’t want to open a different panel. It is also useful to take a quick peek to another part of the code without losing the line where you have been working.
This option is compatible with other panels too:
Code navigation
A wonderful feature which is made possible by the VSCode extension for Julia is code navigation.
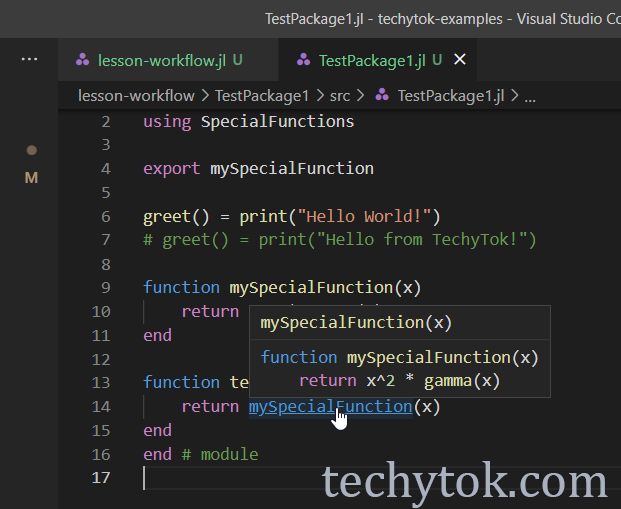
Imagine that you are developing a module, and you want to quickly see the function definition, and in particular the function signature. In order to do it, simply press CTRL and hover your mouse cursor over the name of the function. You will see a small window with the function definition:
If you want to quickly go to the function definition, just CTRL+Click on the name of the function. If you want to go back to where you where before, and you have a mouse with additional side buttons, you can press the “back” button to go back.
Please notice that code navigation works under certain premises, in particular at the moment you can only navigate to functions defined inside the same module/namespace. This means that you won’t be able to navigate to the definition of a function defined inside a module, if you are working with a script. This is due to the fact that a script runs in the “Base” namespace.
Find and replace
One simple yet useful feature is the ability to find a certain word and eventually replace it. In order to open the find panel, just press CTRL+F. To open the replace menu, click on the small arrow on the left of the find field. You will then be able to replace a word with another one.
Sometimes, you decide that you want to refactor your code and change the name of a function. In order to replace a string everywhere in a folder/whole project there is the Find in Files feature. In order to access it, press CTRL+SHIFT+F. This menu will help you find a certain string in your whole project directory, and eventually replace it.
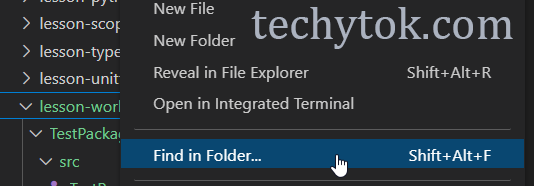
If you want to search a string only in one folder, right click on the folder name in the file explorer and press Find in Folder.
Multi line cursor
Imagine that you are copying a piece of code and you need to modify the name of a variable. This could be done with the find and replace function, but sometimes it is just faster to do some edits manually. Nonetheless, usually we don’t want to write the same thing over and over, and for this reason the multi cursor feature comes in handy.
To place your cursor simultaneously at different places, keep ALT pressed and click on the new positions: you will see something like this:
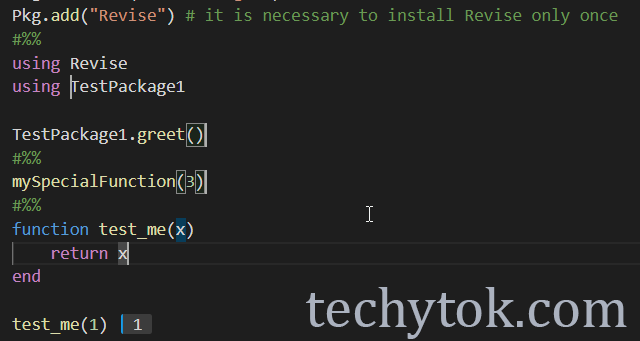
If you write something, it will now be written simultaneously by all your cursors.
Documentation panel
In the Julia extension panel (Julia symbol on the left toolbar), there is a handy documentation tab where you can search for the documentation of a function:
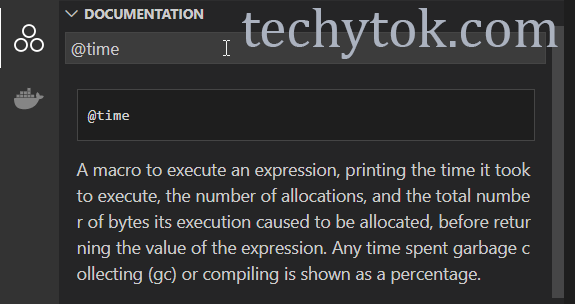
This panel behaves as the help function would, with the additional bonus that the markdown will be rendered, and thus the documentation will look similar to the official online julia documentation. You can use this panel to quickly look for the signature of a function, of for an example on how to use it. If you properly document your functions, you will also be able to access the documentation for your functions.
At the time of writing, the documentation panel does not seem to work properly. It seems that not every function for which the documentation is available through the help function is researchable.
Variable explorer
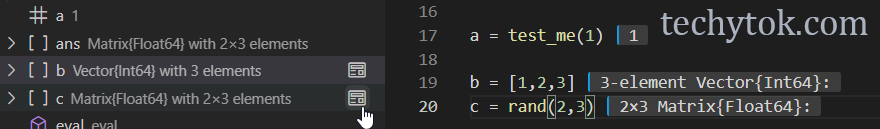
In many cases, it might not be practical or you might not want to write the code to print a variable. It is possible to access the value of any defined variable through the variable explorer. If you open the Julia extension, there will be a panel called WORKSPACE where you can see all the available namespaces (one for each module, and the global scope).
If we define some variables, like a number, a vector and a matrix, we will be able to see their content in the variable explorer:
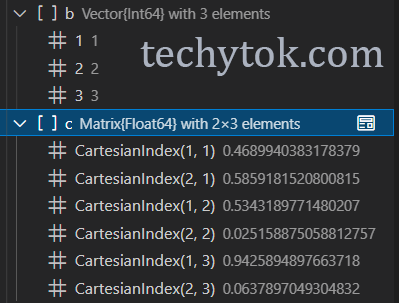
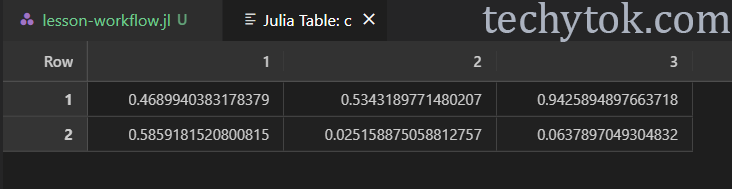
It is also possible to expand matrices and view them in a gird view by clicking on the small button on the right of the variable name (open in VSCode):
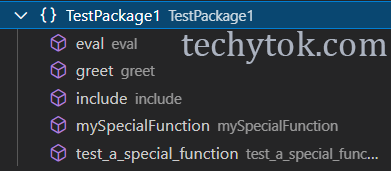
Please notice that since a function is just a particular type of variable, it is possible to also see a list of the functions defined inside a module/REPL using the variable explorer:
Debugging
Debugging is the process of finding and resolving bugs (errors) within a piece of code. You might have never used a debugger before, but I’m sure you already experience with some sort of debugging. A basic way of debugging a piece of code consists in adding print statements here and there, to see what is happening inside the code.
Although adding print statements is extremely simple and intuitive, it is often not the the best solution to debug a piece of code. First of all, to print only certain variables is extremely limiting, since your bug might involve some of the variables/functions which you have not printed. Furthermore, you will have to remove all those print calls at a certain point, wasting a lot of time.
As you might imagine, the proper solution to extensively debug a piece of code is to use a debugger. Julia comes with a powerful debugger which is further integrated into VSCode. I am sure you will love it!
First of all, let’s define a simple “working” function and see how we can explore it using a debugger:
function helper_function(x)
    return log10(x) +3
end

function debug_me(x)
    a = zeros(10)
    for i in 1:length(a)
        a[i] = helper_function(x*i)
    end
    b = a ./ 3
    return sum(b)
end
Breakpoints and code navigation
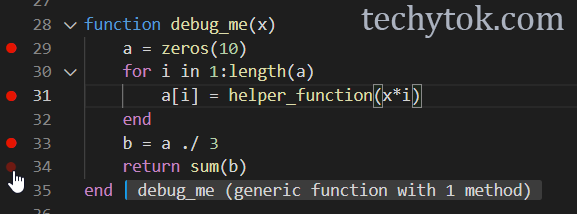
Before we can debug a function, we usually want to add breakpoints. A breakpoint is a line in the code/function where the debugger will pause the execution and let you examine all the variables which are stored inside a function. You would usually want to add a breakpoint before a line where you suspect there might be a problem, or if you want to inspect the state of some of the variables. As a rule of thumb, you can just add a breakpoint wherever you feel like you would add a print statement. Don’t worry about adding too many breakpoints, you can always disable them later.
To add a breakpoint, click on the left of a line: a red circle will appear:
It is possible to debug Julia code in two ways: you can either debug a whole script or debug a single function.
To debug a whole script, you can either press F5 or click the debug icon on the top right corner of vscode:
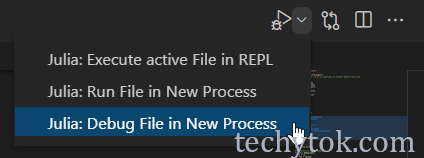
Since I mainly develop my code in interactive mode together with Revise, I prefer to debug my code interactively too.
To debug a single function, you can either use the @enter or @run. Let’s see how this works before we delve into the differences between the two macros. First of all, let’s start the debugger:
@run debug_me(3)
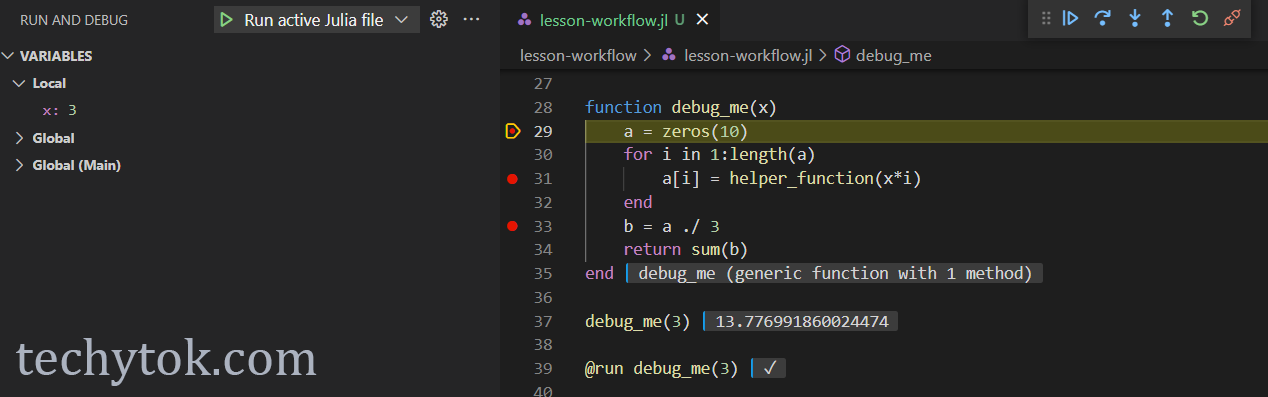
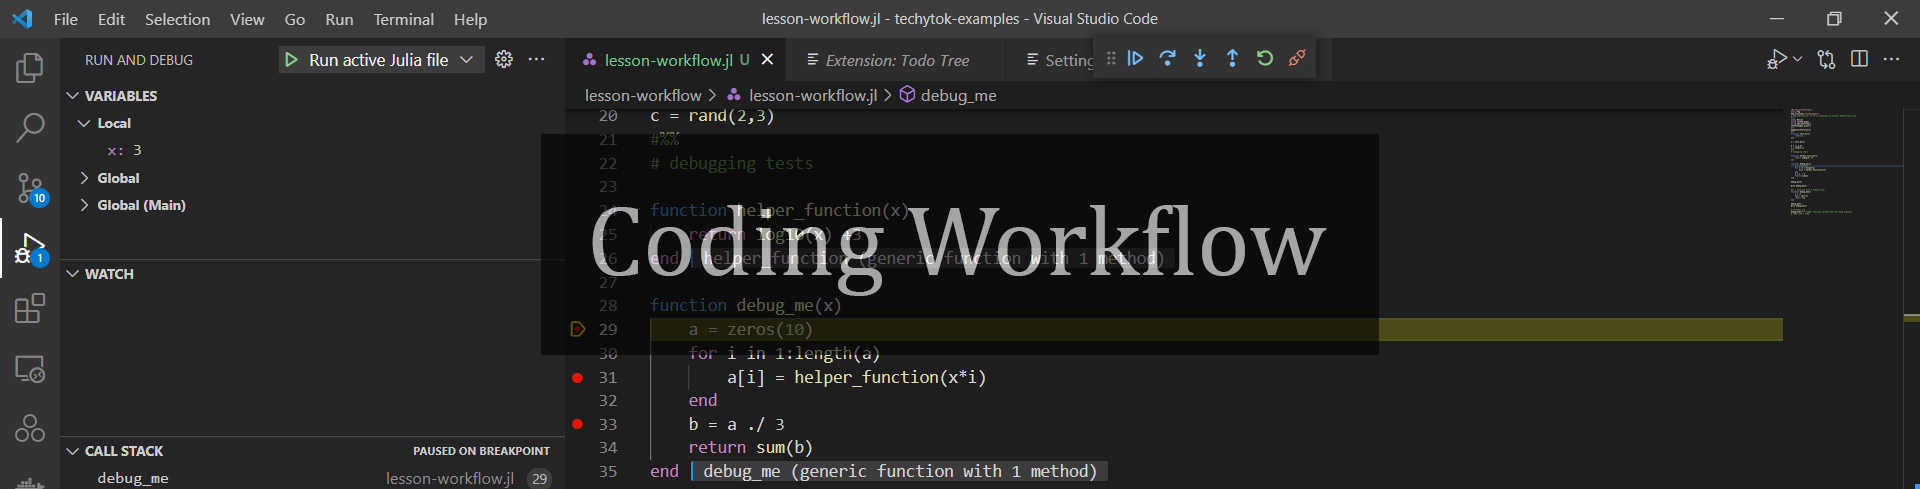
A new window should open on the left side of VSCode. There are several tabs in that window, for now let’s focus our attention on the Variables tab. Here we can see the value of all the variables defined inside the function which we are debugging. At the beginning, the only known variable is the function argument x.
To navigate our code with the debugger, we will use this command panel (usually on the top center of the VSCode window):
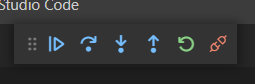
There are several buttons:
- Continue (
F5) - Step Over (
F10) - Step Into (
F11) - Step Out (
Shift+F11) - Restart
- Disconnect
If we press Continue, the debugger will continue to the next break point. If we press Step Over the debugger will advance by one line. If we press Step Into when we are currently on a line where a function is called, the debugger will take us inside the function definition. Once we are inside a function, if we want we can further proceed line by line (with Step Over) and Step Intoother function calls. If we stepped into a function definition, we can come back to the position where we were before with Step Out, effectively stepping out of the function call.
Since it is not possible to go back one step in the execution of a function, if for some reason we want to start over, we can press the Restart button.
The debugger will automatically exit once the function has been completely evaluated. If we want to stop the debug early, we can press the Disconnect button.
The @enter and the @run macro behave similarly. In particular, the @enter macro will activate the debugger and pause the execution at the first line inside of the function. On the other hand, @run will start the debugger and run the function up to the first breakpoint. Depending on what you want to achieve, you can use either one of them to start the debugging process.
Debugger panels
Now that we have understood how to navigate code with the debugger, let’s see how to inspect the code with the debugger. I encourage you to run the debug_me function with the debugger attached and try the various combinations of buttons to see what happens. As you press the Continue button, you will see that new variables appear in the variables tab, and their value will change.
There are several other panels beside the Variables panel, let’s see what they do.
The Watch panel can be useful to keep an eye on an expression or variable, which is not necessarily part of the function body. Let’s imagine that for some reason we want to monitor the value of sum(a.^2), we can add that expression in the watch window:
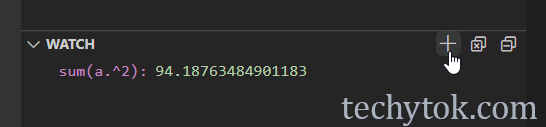
As we press the Continue button, the value of the expression which we are watching is gonna be updated.
There are three additional panels: Call Stack, Breakpoints and Compiled.
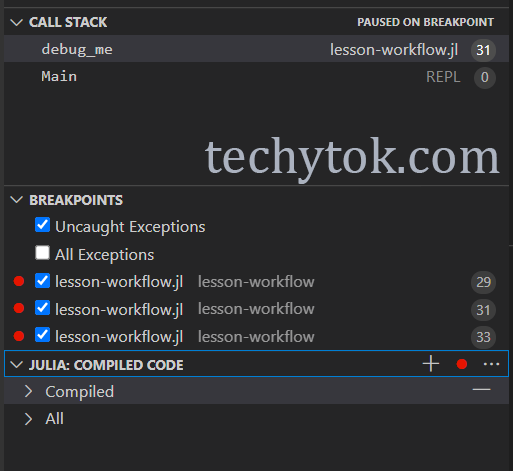
The Breakpoints panel shows all the breakpoints in your code, and you can manually activate/disable them without removing them from the code.
The Call Stack panel displays which function is being debugged, which is useful not to get lost in a rabbit hole while debugging. By clicking on one of the function names you will reach the corresponding function definition, which might be useful for code navigation.
The Compiled tab allows the user to trigger compilation of some functions inside the call stack. If the code execution is extremely slow and you are not interested in debugging some of the functions involved, you can trigger compilation for those functions. This is an advanced topic which will not always be useful. for further information, see the official documentation.
Editing the function namespace
Using a debugger can be extremely useful when a function throws an error. Let’s consider this function:
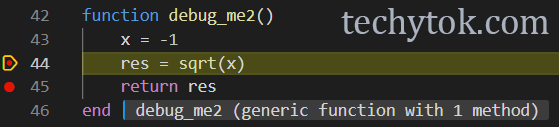
function debug_me2()
    x = -1
    res = sqrt(x)
    return res
end
As we can see, this function computes the square root of a negative number, which does not exist in the domain of real numbers. If we call this function, Julia will throw a DomainError, saying that if we want to compute the square root of a negative number, we must specify that we are working with complex numbers.
The debugger can be useful to troubleshoot what is going on inside a function. In this case it is obvious why x is a negative number, but with a more complex function we might not know why we reached that result. Let’s add some breakpoints, start the debugger with @run debug_me2() and head to the variables explorer.
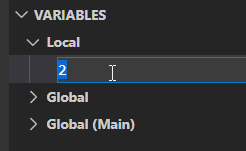
Imagine that you have started the debugger, proceeded step by step and reached the domain error. We now start over and decide that we want to modify the value of x while the function is still running. For testing purpose, we want to see if a positive value of x will solve the domain error problem (spoiler: it will). In order to modify the value of a variable mid run, we can use the variables explorer window. Double click the x variable and change its value to 2:
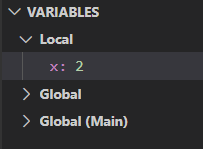
You can now ask the debugger to Continue and you will not encounter the domain error anymore. Please notice that changing “manually” the value of x has not changed our code, it only let us better understand that the x variable is responsible for the domain error.
While the debugger is running, it is also possible to evaluate pieces of code inside the function namespace. This means that if for some reason we want to do some tests on the variables defined inside a function, we can do it without writing any additional code inside the function definition. Let’s start over the debugger, by disconnecting it and running @run debug_me(3).
In the same window where the REPL is (middle bottom part of the VSCode interface) you can see that there is a new DEBUG CONSOLE now:
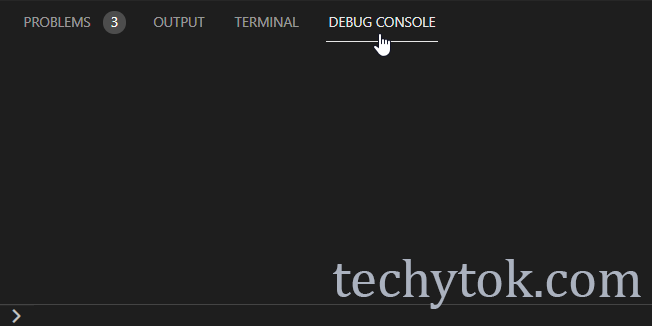
This is a REPL which runs “inside” the namespace of the function. This means that we can evaluate any expression as if it was written inside the function:
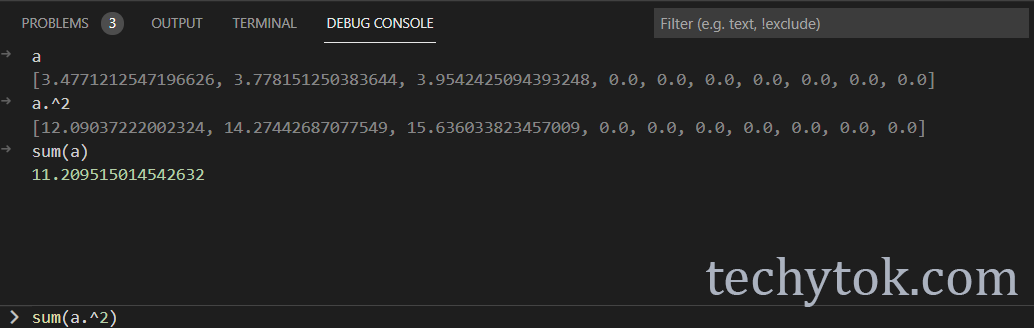
Please note that you can also change the value of any of the variables which exist inside the function, for example by writing a .+= 2 . This is a double-edged sword and you have to pay attention to what you are doing if you are evaluating code inside the function context. Anyway, if you commit some mistakes, you can always restart the function debugging, so nothing you do in the debug console is permanent.
Function profiling
This section is an excerpt from the code optimisation lesson.
Profiling is the practice of measuing the execution time and memory usage of each part of a piece of code, in order to better understand how to optimise it. In this section we will learn how to find the bottlenecks in the execution of a function, so that we know which parts of the function should be optimised.
As you probably already know, it is possible to measure the execution time of a function using the @time macro or preferably @btime (which is included in the package BenchmarkTools). They are useful when we want to measure a single function call, but they give no information on what is making a function slow. For this reason we need a tool that enables us to identify which line of code is responsible for the bottleneck.
Luckily there are two exceptional packages which help us in profiling: Profile and the Julia IDE for VSCode. Both of the tools will run the desired function once and will log the execution time of each line of code.
Profile works completely in the REPL and will produce a log file. On the other hand, with the support of VSCode we will be able to display the profiling information in a graph.
Profile
Let’s write two new functions which perform heavy calculations:
function take_a_breath()
    sleep(0.2)
    return
end

function test8()
    r=zeros(100,100)
    take_a_breath()
    for i in 1:100
        A=rand(100,100)
        r+=A
    end
    return r
end
We shall now profile test8:
using Profile
test8()
Profile.clear()
@profile test8()
Profile.print()
If you see a log file extraordinarily long, run line 2 to 4 again as it is possible that you have profiled the compilation of some functions and not test8.
You should see something like:
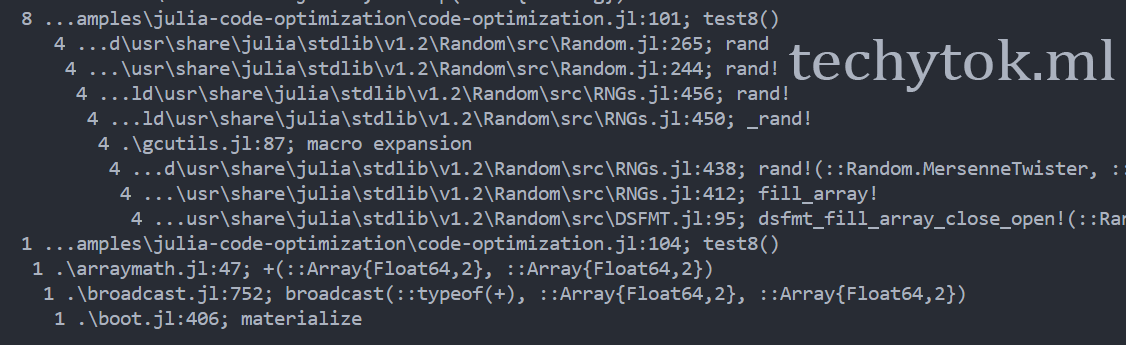
The number 8 (which may vary) is an indication of how long a function runs. We also have a 1 and a 4, so probably this block is the one responsible for the bottleneck. Profile thus gives you a hint that at line 101 (line 8 of the code snippet) there is a bottleneck: who would have imagined that sleeping for 22ms would have been a slow down?
Unfortunately using Profile.print() is not really user friendly and for this reason VSCode comes in our help!
After having called test8 again, to make sure that the function has been properly compiled, we call the profile viewer macro @profview
test8()
@profview test8()
If you have done everything correctly, a new panel should open on the right side of VSCode and you should see something like this:
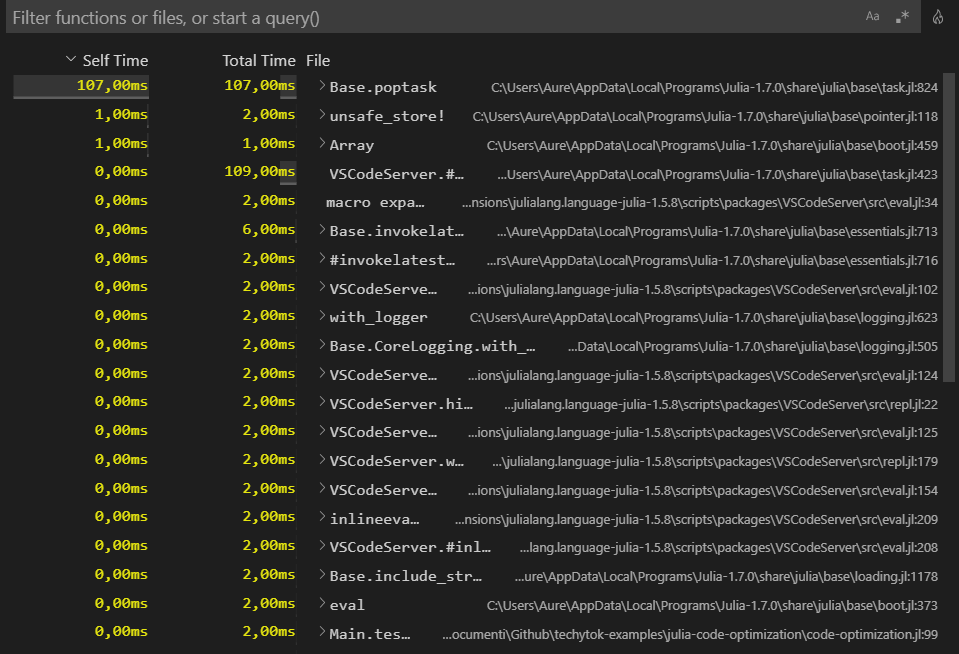
This list will show you at a glance which are the functions which take more time in your code (in our case, the sleep or wait function) and you can easily evaluate which are the bottlenecks.
It is also possible to display the profiling graphic as a fire graphic. In order to do it, click on the small fire icon on the top right corner of the profiling window (you might have to install an extension). You will see something like this:
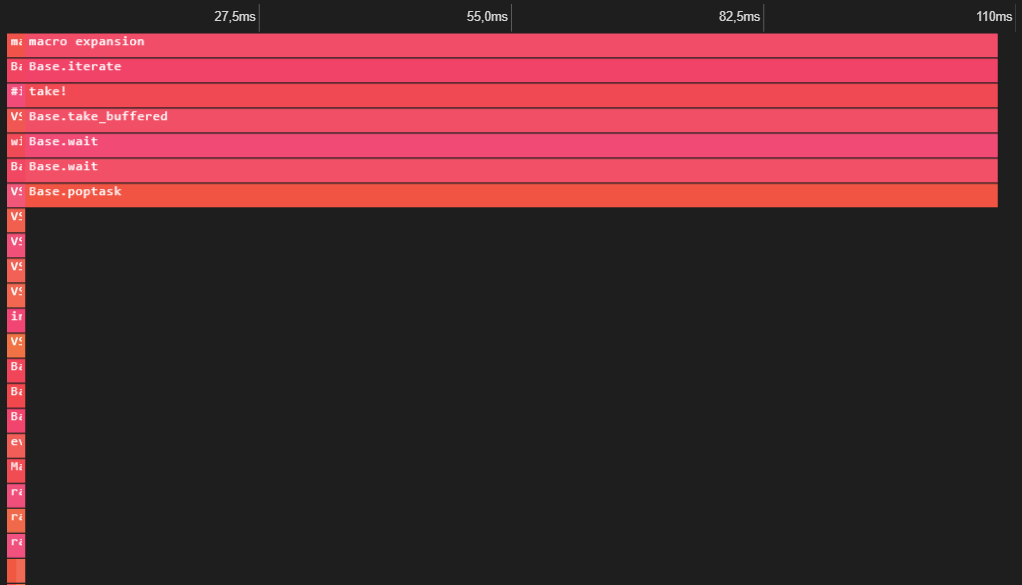
In this case, the flame graph is not that informative, since the function is extremely simple, but it is a handy tool when profiling complex functions. The graph should be read from the top to the bottom. The functions on the top usually call the functions under them. If more than one function is involved you will see several branches and the graph will become more complex.
I encourage you to hover your mouse pointer on the functions in the fire graph: you will see the run time of each function involved and you are also able to jump to each function definition. In many cases, the profiler will also add a note on top of the called functions stating how long it took to run them. In order to scroll the flame graph, press ALT and use the scroll wheel, or click and drag the plot. To zoom on a region of the flame graph, point to it and use the scroll wheel.
Problem tab
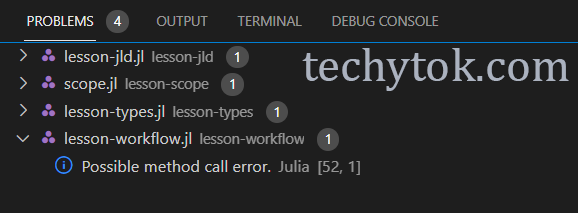
VSCode will also suggest you if there are some possible problems with your code. For example, you might have called a function with the wrong arguments, or redefined a constant. It is possible to see all the possible problems with your code in the Problems tab:
TODO explorer
This is not properly a feature of the Julia VSCode extension, but it is something that I would like to show you nonetheless. When you are writing, you might often find yourself in a situation where you want to add a note that you need to be able to easily find. For example you might want to add a TODO (like TODO: add documentation), or you have written some piece of unsightly code that need to be fixed and you want to tag it with FIXME.
All these notes can be written as a code comment in the form:
debug_me2(3) # FIXME: function called with the wrong argument
# TODO: add a TODO
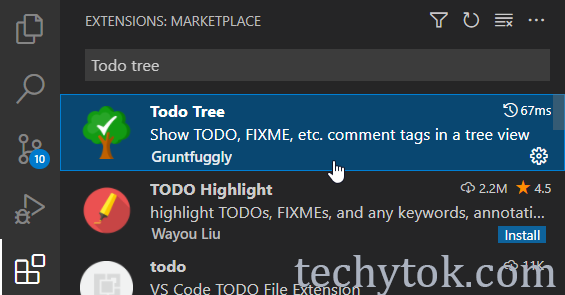
In order to color code them and be able to easily find them, you can install the Todo Tree extension. To install it, go to the extension tab and type the name of the extension in the search bar:
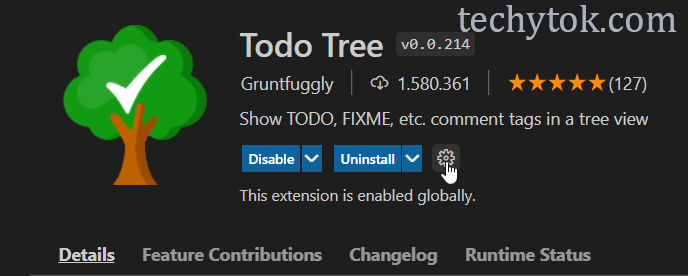
After you have installed it, press the small cogwheel to open the extension configuration menu and search for useColourScheme to enable color coding the annotations.
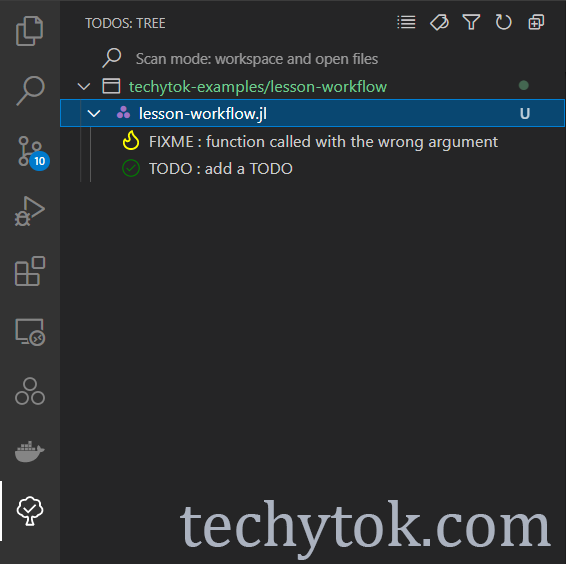
After you have done that, your code will look like this:

There will now be an additional icon in the left toolbar with a tree which will list all your TODOs, FIXMEs, and so on!
Conclusions
In this lesson we have explored how to use Revise, how to better navigate and organise your code an how to debug it. I encourage you to take your time to familiarise with all the tools available in the VSCode IDE. It will take some time, but they will help you improve your efficiency while coding.
If you liked this lesson and you would like to receive further updates on what is being published on this website, I encourage you to subscribe to the newsletter! If you have any question or suggestion, please post them in the discussion below!
Thank you for reading this lesson and see you soon on TechyTok!


Leave a comment